
How Does MIM Differ from Powder Metallurgy (PM)? Process Route, Density & Cost Optimization Strategy
Published:
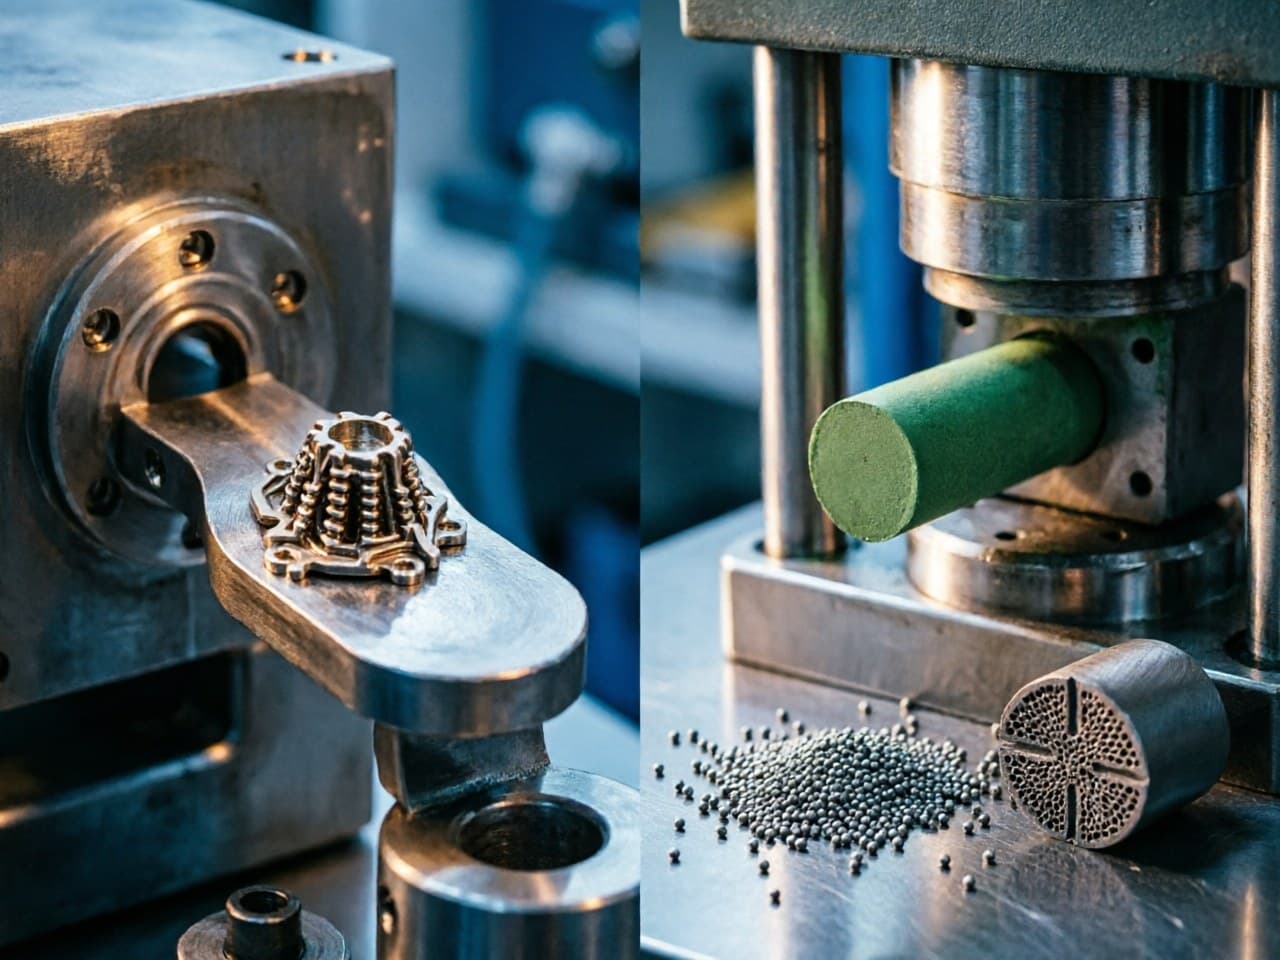
How Does MIM Differ from Powder Metallurgy (PM)? Process Route, Density & Cost Optimization Strategy
Author: Newlife - MIM (新莱福MIM应用工程团队) | Material: | Industry:
How Does MIM Differ from Powder Metallurgy (PM)? Process Route, Density & Cost Optimization Strategy
Application Pain Points: Why the MIM vs PM Decision Matters
Design engineers and procurement teams frequently face a critical fork in the road: should a small, complex metal component be produced via Metal Injection Molding (MIM) or conventional Powder Metallurgy (PM, i.e., press-and-sinter)? Choosing incorrectly can result in:
- Over-specified density — paying for MIM's ≥96–98% theoretical density when 85–92% (typical PM) would suffice, inflating unit cost by 30–60%. - Under-specified geometry — forcing a complex 3D feature into a uniaxial press die, requiring costly secondary machining that erodes PM's cost advantage. - Missed volume economics — PM excels at hundreds of thousands of simple gears per month; MIM excels at intricate sub-10 g parts where die complexity amortizes over volume. - Mechanical performance gaps — fatigue life, corrosion resistance, and magnetic permeability all correlate with sintered density; selecting the wrong route can yield field failures.
Understanding the first-principles drivers behind each process empowers teams to optimize total cost-of-ownership rather than piece price alone.
---
MIM vs PM Selection Comparison Table
Parameter | MIM (Metal Injection Molding) | PM (Press & Sinter) |
Typical part mass | 0.05–50 g (sweet spot < 20 g) | 5–3,000 g |
Geometric complexity | Very high (undercuts, thin walls ≤ 0.3 mm, 3D features) | Moderate (2.5D, limited undercuts) |
Relative sintered density | 96–99% | 82–92% (up to ~95% with double-press/double-sinter) |
Dimensional tolerance | ±0.3–0.5% of nominal | ±0.1–0.3% (near-net in pressing direction) |
Surface finish (as-sintered) | Ra 0.8–1.6 µm | Ra 1.6–3.2 µm |
Tooling cost | Medium–high (injection mold) | Medium (compaction die set) |
Economical annual volume | 10,000–10,000,000+ | 50,000–10,000,000+ |
Material systems | Stainless steel, Fe-Ni, tungsten alloys, soft magnetic alloys, Ti | Iron-based, Fe-Cu, Fe-Ni, brass |
Secondary operations needed | Minimal (near-net shape) | Often: machining, sizing, infiltration |
---
First-Principles Derivation: Density and Strength Linkage
Principle 1 — Porosity–Strength Relationship
The mechanical strength of a sintered part can be approximated by a power-law relation:
Where: - σ₀ = fully-dense material strength - ρ/ρ_th = relative density (sintered density / theoretical density) - n ≈ 3–6 for tensile/fatigue properties of PM steels (empirical)
What this means for your design: A PM part at 88% relative density may retain only ~65–72% of wrought-equivalent tensile strength (assuming n ≈ 4). A MIM part at 97% relative density retains ~88–92%. If your application demands fatigue resistance near wrought levels — e.g., firearm bolts, surgical instruments, automotive turbo vanes — MIM's density advantage is not optional; it is structural.
Principle 2 — Cost-Per-Feature Complexity Index
A useful optimization heuristic:
Where N = annual production volume.
What this means for cost optimization:
- For simple geometries at high volume, PM minimizes C_total because C_tooling/N is small and C_secondary ≈ 0. - For complex geometries, PM's C_secondary (machining, assembly of sub-components) escalates rapidly. MIM eliminates most secondary operations by consolidating features into one net-shape shot — reducing C_secondary toward zero even though C_material (finer powder) and C_sintering (debinding cycle) are higher.
The crossover point is application-specific, but industry data suggests MIM becomes cost-competitive when a part has ≥ 3 geometric features that would require secondary machining in PM, and volume exceeds the low tens of thousands of parts per year.
---
Design Parameter Recommendations
Design Scenario | Recommended Route | Rationale |
Flat gear, 50 g, 200k/year, density ≥ 85% sufficient | PM | Simple 2.5D, large volume, low density requirement |
Watch clasp, 1.5 g, complex 3D, 316L, 500k/year | MIM | Ultra-small, intricate, corrosion-resistant, high density needed |
Soft magnetic pole piece, tight permeability spec, < 5 g | MIM | Density ≥ 97% critical for magnetic saturation; complex geometry |
Structural bracket, 120 g, moderate complexity | PM or machining | Mass exceeds MIM sweet spot; evaluate hybrid approach |
Tungsten alloy counterweight, 8 g, ρ ≥ 17.5 g/cm³ | MIM | High-density tungsten alloy system; near-net shape avoids grinding |
Rule of thumb: If your part is < 20 g, has features in more than one axis, and requires relative density > 95%, MIM should be your default starting point.
---
Newlife - MIM Solution: Optimizing Your Process Route Selection
Newlife - MIM offers engineering teams support when navigating the MIM-vs-PM decision:
1. Multi-Material System Capability Newlife - MIM maintains production experience across stainless steels, iron-based alloys, soft magnetic alloys, tungsten-copper composites, and high-density tungsten alloys, enabling benchmarking of a given part across multiple material–process combinations to identify the cost-performance optimum.
2. High-Precision Near-Net-Shape Control For applications where PM's typical 85–92% density range is insufficient, Newlife - MIM sintering processes target relative densities of 96% and above. This reduces the need for additional densification steps such as HIP in many cases.
3. Integrated Process Coverage Newlife - MIM manages the process chain from powder preparation through injection, debinding, sintering, and selected post-processing operations. This integration supports comparative evaluation of MIM and PM routes for the same geometry when both are feasible.
---
Action Checklist for Engineers & Procurement Teams
1. Map your part's complexity index — count features requiring multi-axis tooling or secondary machining in PM; if ≥ 3, evaluate MIM. 2. Define minimum density requirement — use the σ = σ₀(ρ/ρ_th)^n relationship to determine whether 88% or 97% density meets your safety factor. 3. Estimate total cost (not piece price) — include secondary operations, scrap, and quality risk in your C_total model. 4. Request comparative prototypes — ask your supplier to produce the same geometry in both MIM and PM (where feasible) and compare density, dimensional Cpk, and surface finish. 5. Validate material system availability — confirm your alloy (especially specialty systems like W-Ni-Fe or Fe-Si soft magnetic) is production-proven at your target density. 6. Contact Newlife - MIM for process route optimization — visit the Newlife - MIM website to submit your part drawing or 3D model for a MIM-vs-PM feasibility comparison and budgetary quotation.
---
References
1. German, R.M. *Powder Injection Molding: Design and Applications.* Metal Powder Industries Federation (MPIF), 2003. 2. German, R.M. *Sintering Theory and Practice.* Wiley-Interscience, 1996. 3. MPIF Standard 35, *Materials Standards for Metal Injection Molded Parts,* 2016 Edition. 4. Heaney, D.F. (Ed.). *Handbook of Metal Injection Molding.* Woodhead Publishing, 2nd Edition, 2019. 5. Chawla, N. and Deng, X. "Microstructure and mechanical behavior of porous sintered steels." *Materials Science and Engineering A*, 390(1–2), 2005, pp. 98–112. 6. ASTM B883-19, *Standard Specification for Metal Injection Molded (MIM) Materials.*